Welcome To New Chrome DevTools
What’s New in DevTools

Hello, everyone here is the super cool stuff is waiting for you , in Chrome Devtools 78 and recently held Chrome Devtools 79 for 2020. Lets talk about what are mentioned in Chrome Devtools 78 and later we go on to Devtools 79
What We are Covering
Multi-Client Support in Audits Panel
Payment Handler Debugging
Light House 5.2 in the Audits Panel
Largest Contentful Paint -LCP in the Performance Panel
File Devtools issues from the Main Menu
Multi-Client Support
Multi-client support which means that you can now experiment with code changes within devtools and then audit the page to see how those changes affect your score.
Steps to open Audits panel
First Run your application locally and open in Google Chrome >> [ ctrl+shift+ I ] or [cmd + shift + I ] to open devtools . Then , Go to Audits and click on Run audits.

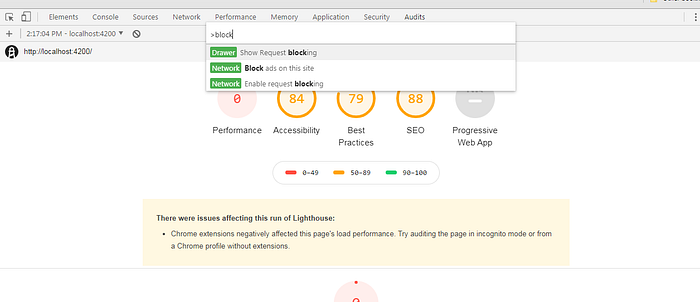
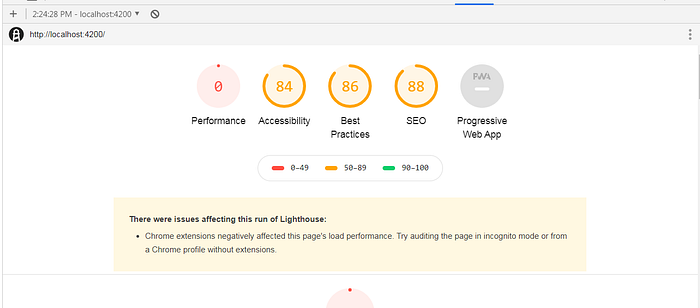
This, is the screen you experience when you click on Run audits.

Here, my audits panel report says that my performance score isn’t qualified enough and Accessibility , Best Practices and SEO because this page has blocking resource jQuery . In Opportunities section in that audits panel.

The learn more link tells me: I should use js/css the and if you use jquery it will suggest that you can use the async or defer attribute on JavaScript that isn’t needed for the page load.
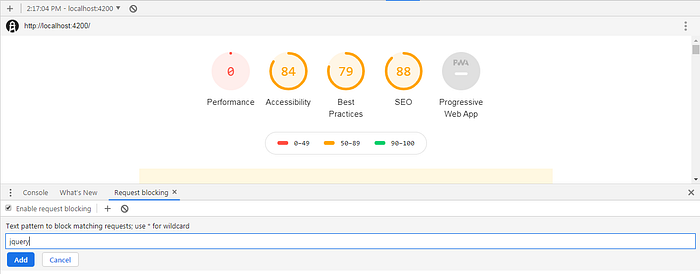
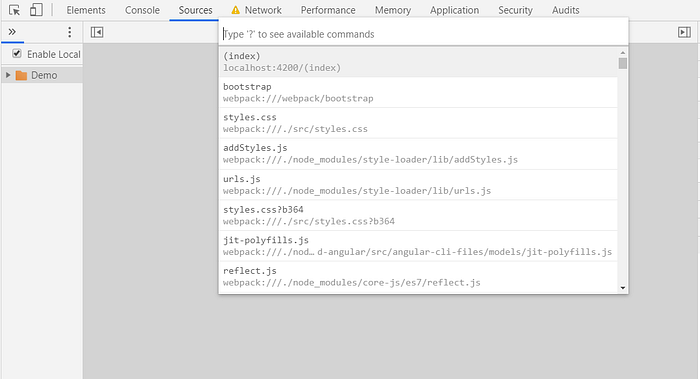
Test out the changes within Devtools . First Let’s just block the jquery request because i don’t need it . Open [Ctrl + Shift + P] >> Block >> Drawer select
Once, you selected the Drawer- Show Request blocking in console panel you can see Request Blocking panel aside. Click Add + icon and add jquery in the input field click on Add.
step2. Add async or defer attribute in script tags for better performance for that . In devtools [Ctrl + shift + P] type overrides >> sources show overrides select this option. Then, select folder for overrides.
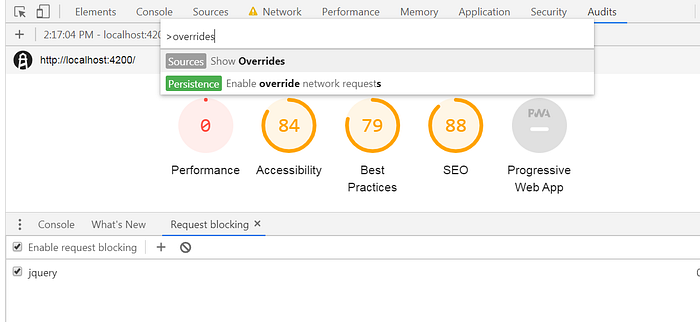
After selecting overrides you have to click on + select folder and select the current project folder from your system. Then, it pop out a notification to Allow or deny. click on Allow to make changes.
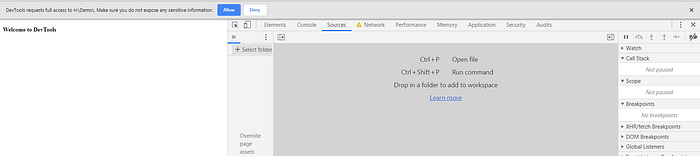
Your selected folder will appear in side nav >> Demo
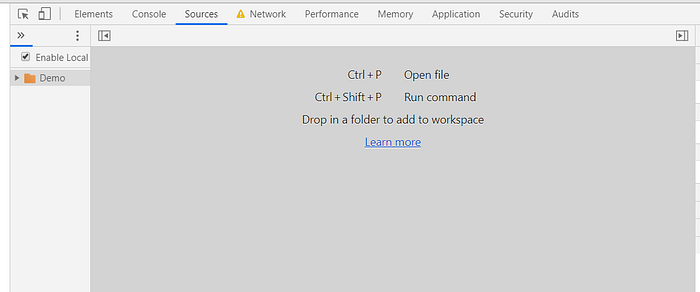
[Ctrl + P] to select the index.html page to add the async or defer attributes in script tag.

After, you made change in the html page [Ctrl + S]
Now, return to Audits panel and again click on Run Audits , now see the performance and other metrics will change .
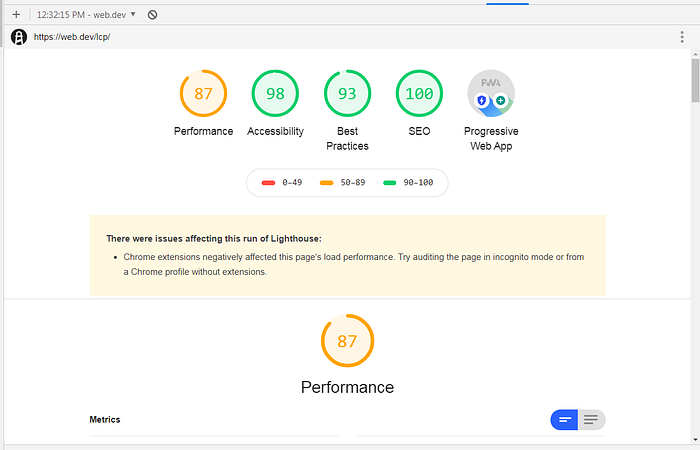
Like this, we can increase the performance of the application also.
Good Application performance looks like this, this is the way to use Multi client support in audits panel.
Payment Handler Debugging
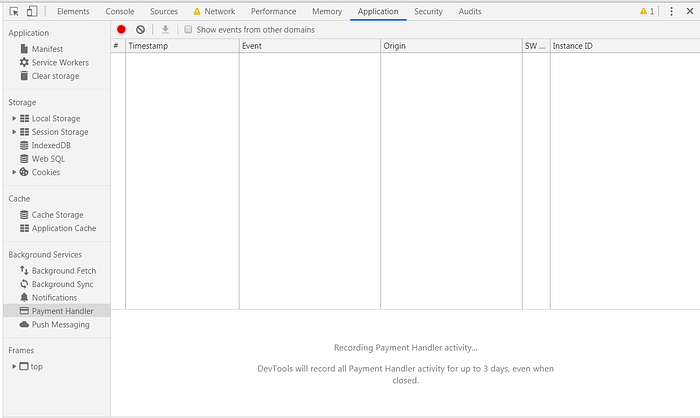
The background services section of the application panel now supports ‘Payment Handler Events’.
The Payment Handler API makes it easier to collect payment information from users which you can learn more about in this article to debug payment handler events.
Go To Application Panel >> Select Payment Handler Section . Then, click record dev tools will now record payment handler activity for 3 days, even when dev tools is closed.
When, you made any payment transaction you can see here with corresponding details. click on Show events from other domains. Then click on the details transaction you can see the details of the card and payment transaction as well.
Light House 5.2 in the Audits Panel
The new third party usage diagnostic audit tells you how much third party code your page requested and how long that third party code blocked the main thread while the page loaded.
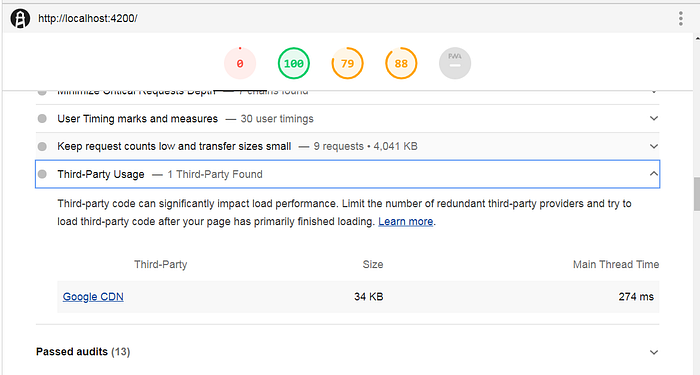
In the performance section of my audits report i can see the [Third-Party Usage audit]. If i click that audit to expand it . I see which third party domains were detected on my page and total size of the network requests coming from that domain and the amount of time that each third party blocked the main threat.
Largest Contentful Paint in the Performance Panel
The largest Content full paint metric is a new metric introduced in chrome 77 that measures when the largest content element in the view port was rendered.
At Performance recording the LCP marker in the timing section tells you when your LCP event happend.
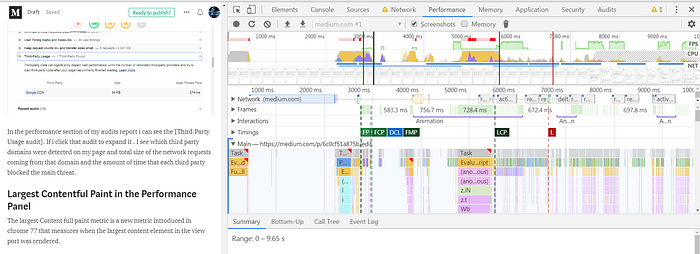
If you hover over the marker, dev tools highlights the largest content element node in the viewport or you can click the marker then open the summary tab and hover over related node. If you click related note dev tools opens that node in the DOM tree.
File DevTools issues from the Main Menu
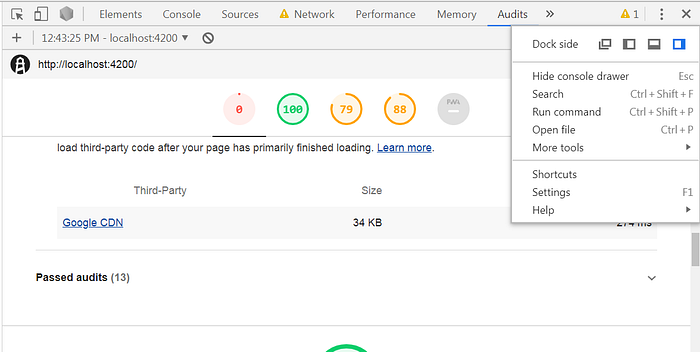
If you ever encounter a bug in dev tools or have a feature request you can now file issues on the dev tools engineering teams tracker from the main menu.
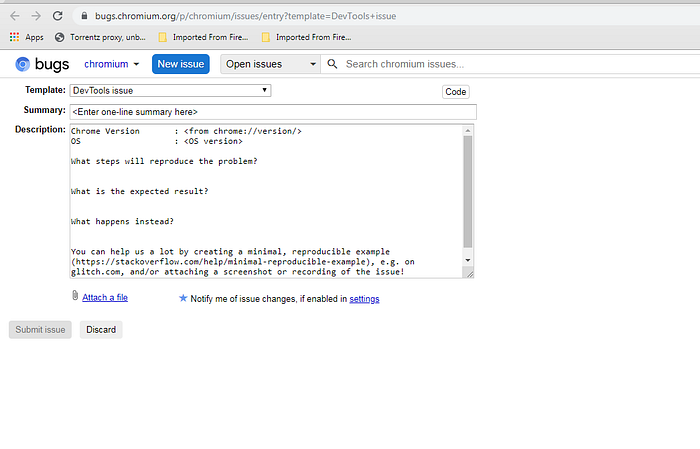
Click Main Menu >> Help >> Report a Dev tools Issue.
Once, you click on the Report a Dev tools issue you will redirect to the new page
What we covered so far, we covered the new dev tools and learnt new things, we haven’t covered in this section is Google chrome Devtools 2020. I will make another blog for that.
Thank you everyone, i am always happy to learn new things and share feel free to comment and correct me if any improvements.